 Webnix
What is Webnix?
Webnix is a web browser for Android with professional developer tools, similar to the DevTools in desktop browsers but designed for a phone screen. Web developers, QA testers and SEO specialists use it to debug and audit websites directly on a real mobile device.
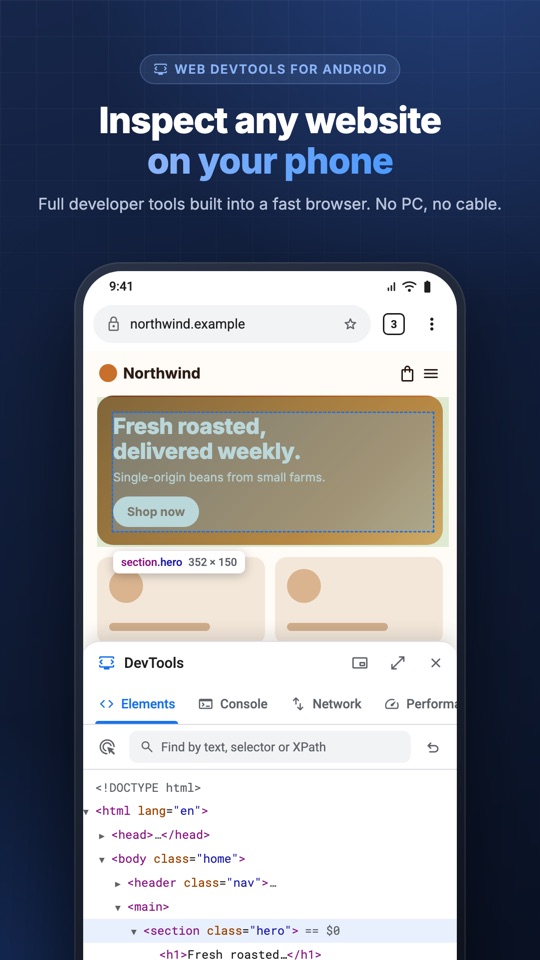
Elements
Inspect element on mobile: live DOM tree, tap-to-inspect, styles, computed CSS, box model and accessibility. Edit HTML and CSS live.
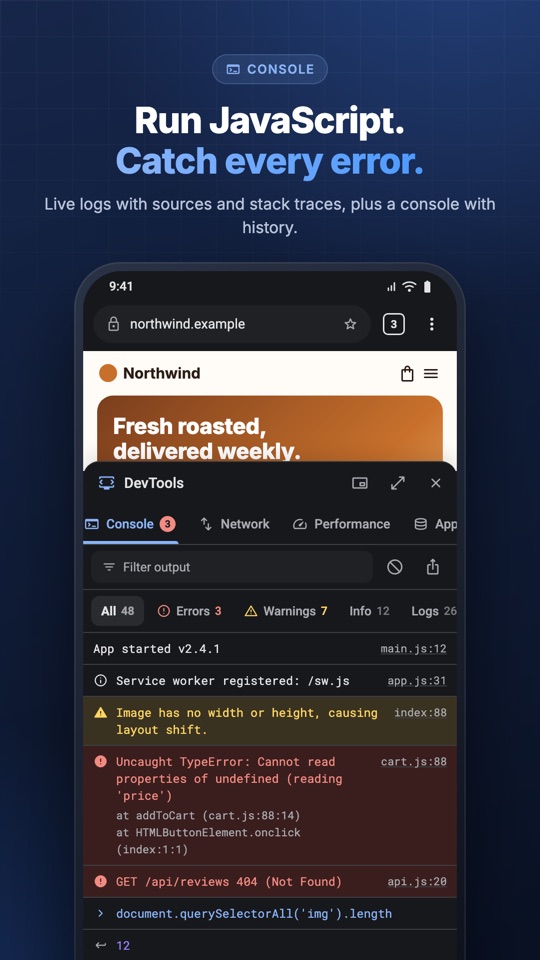
Console
Every log, warning and error with source and stack trace. Run JavaScript on the page with history and $0.
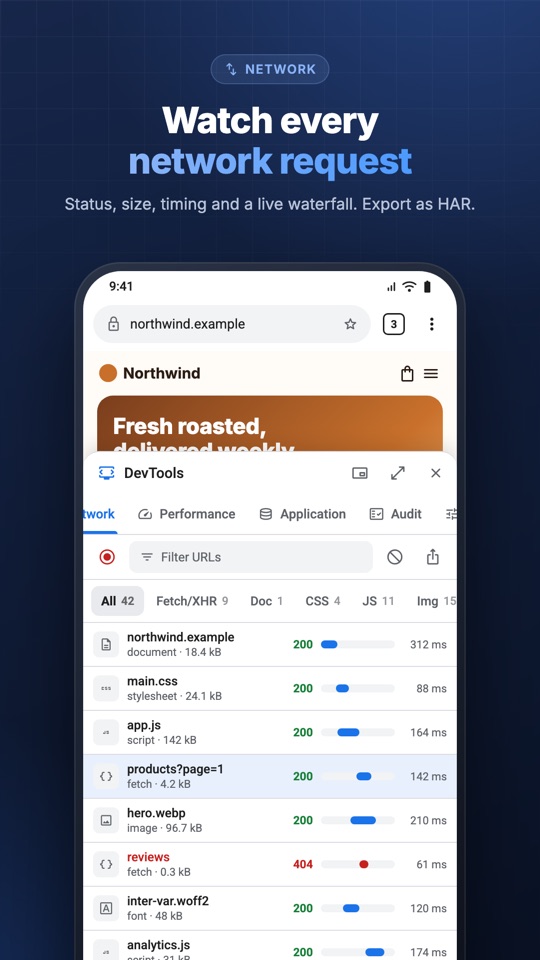
Network
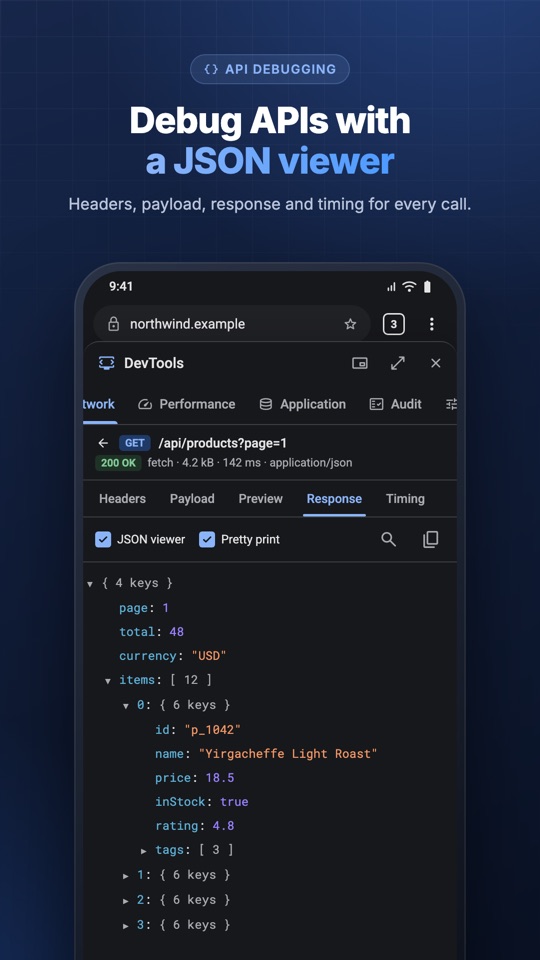
Status, size, timing and waterfall for each request. Headers, payload, JSON viewer, image preview and HAR export.
Performance
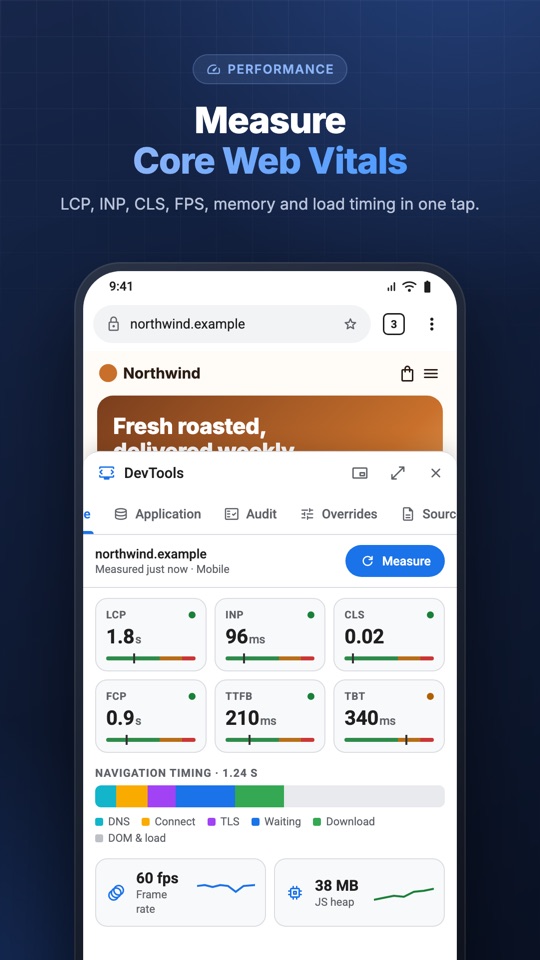
Core Web Vitals (LCP, INP, CLS, FCP, TTFB, TBT), FPS, memory and navigation timing. Export as HTML or JSON.
Audit
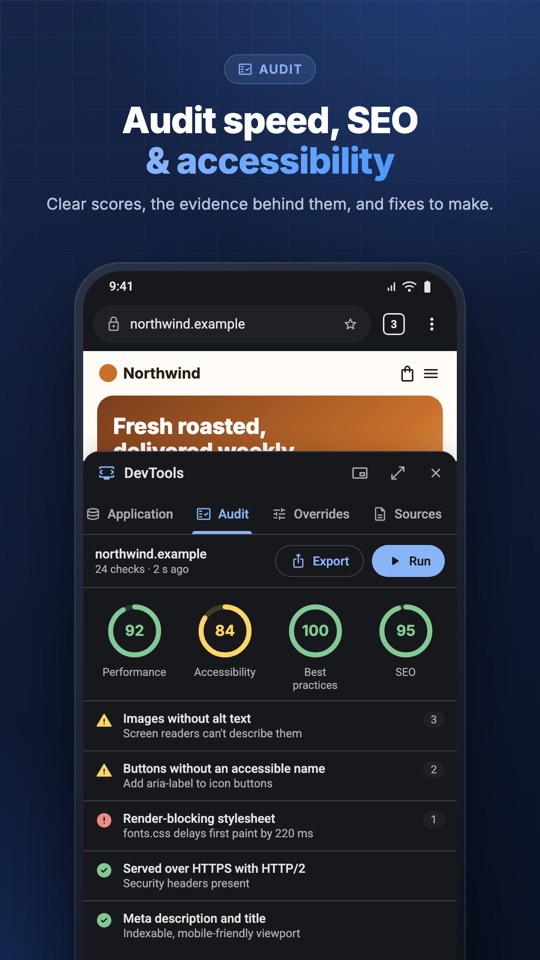
SEO, accessibility, performance, security and best-practice checks with evidence, plus technology detection.
Overrides
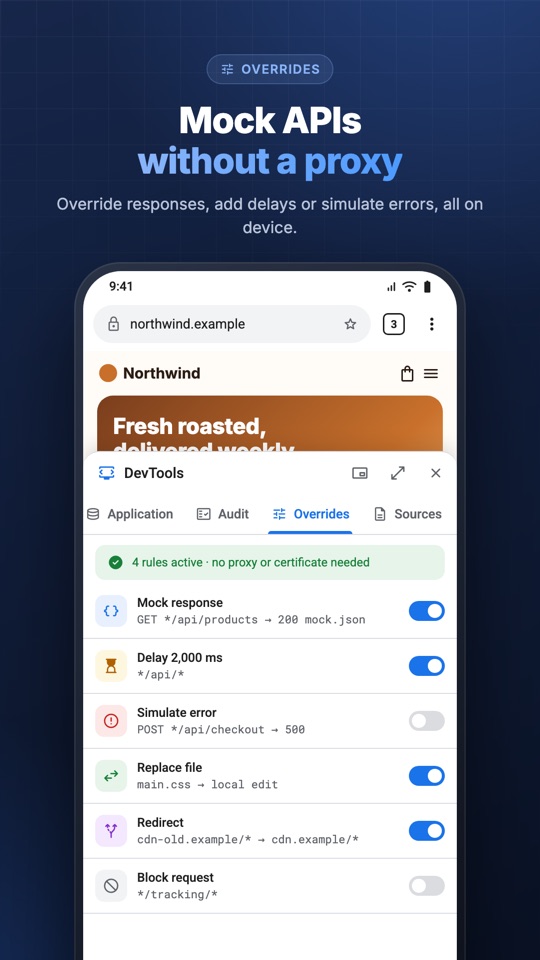
Mock API responses, replace files, redirect or block URLs, add delays and simulate errors, with no proxy.
Application & Sources
Cookies, local and session storage, IndexedDB, cache storage, service workers, manifest, page source and snippets.
Built for phones
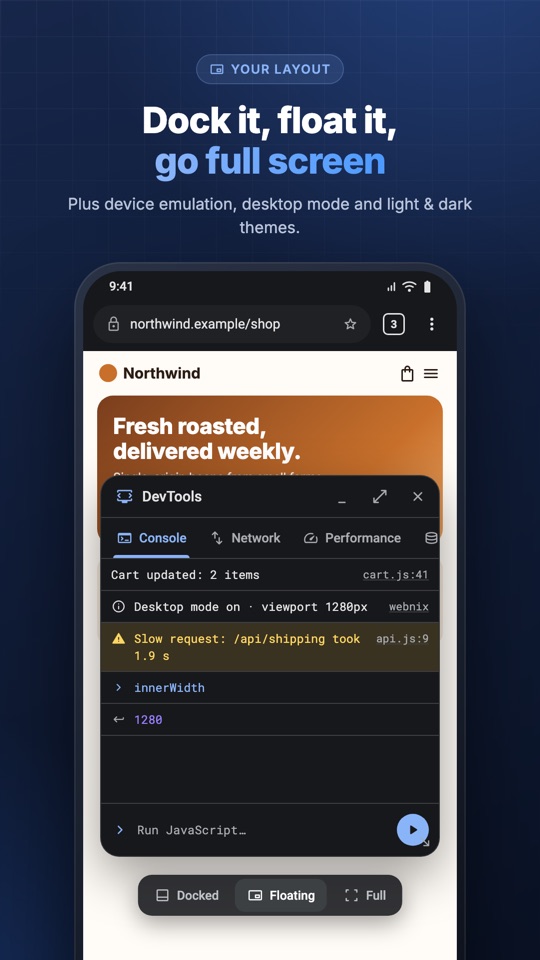
Docked, floating or full-screen DevTools, device emulation, desktop mode, light and dark themes, one-tap bug reports.
How to debug a website on an Android phone
- Install Webnix from Google Play and open the website.
- Tap the DevTools button. Drag the panel to resize it, or switch to floating or full screen.
- Use Elements for HTML and CSS, Console for errors, Network for requests, Performance for Core Web Vitals and Audit for SEO and accessibility.
- Share a HAR file, an audit report, or a one-tap bug report with a screenshot and logs.
Frequently asked questions
Quick answers about debugging websites on mobile.
How do I inspect element on Android without a computer?
Install Webnix, open the website, and tap the DevTools button. The Elements panel shows the live DOM tree. Tap the picker icon, then tap anything on the page to see its HTML, CSS styles and box model. You can edit HTML and CSS live. No PC, cable or USB debugging is needed.
How can I see the JavaScript console on my phone?
In Webnix, open DevTools and choose Console. You'll see every console.log, warning and error with its source file and stack trace, and you can type JavaScript to run on the page.
How do I view network requests or export a HAR file on Android?
Open DevTools › Network in Webnix and reload the page. Each request shows status, size, timing and a waterfall. Tap one to see headers, payload and the response in a JSON viewer. Use the export button to save a HAR file.
How do I view the page source of a website on mobile?
In Webnix, open the menu and choose View page source, or use DevTools › Sources to browse every script and stylesheet with pretty print and search.
Can I check Core Web Vitals on a phone?
Yes. Webnix's Performance panel measures LCP, INP, CLS, FCP, TTFB and TBT on your real device, plus FPS, memory and navigation timing, and exports the report as HTML or JSON.
How do I mock an API response on Android without a proxy?
Use the Overrides panel in Webnix. Create a rule to return a mock response, replace a JS or CSS file, redirect or block a URL, add a delay, or simulate an error. It runs inside the app's browser, so no proxy, VPN or certificate is required.
Can I open the desktop version of a website on Android?
Yes. Turn on Desktop site in Webnix's menu. The page loads with a desktop user agent and a 1280-pixel viewport, and you can pinch to zoom out. Device emulation also lets you pick other user agents and viewport widths.
Is Webnix free and private?
Webnix is free, with no account, ads, analytics or trackers. History, bookmarks and settings are stored only on your device.